Technology and Data Analysis in Commodities Trading.
Algorithmic trading refers to the use of computer‑driven instructions to execute orders in the commodities market. In practice a trader writes a set of rules—such as “buy crude oil futures when the 10‑day moving average crosses above the 30…
Algorithmic trading refers to the use of computer‑driven instructions to execute orders in the commodities market. In practice a trader writes a set of rules—such as “buy crude oil futures when the 10‑day moving average crosses above the 30‑day moving average”—and the system automatically monitors market data, generates signals, and places trades without manual intervention. The primary benefit is the ability to act on opportunities in milliseconds, eliminating human latency and ensuring consistent execution. A common challenge is model over‑fitting, where a strategy performs well on historical data but fails in live markets because it has captured noise rather than true market dynamics. Mitigation requires rigorous backtesting, out‑of‑sample validation, and ongoing performance monitoring.
High‑frequency trading (HFT) is a subset of algorithmic trading that focuses on ultra‑short‑term opportunities, often measured in microseconds. HFT firms invest heavily in low‑latency infrastructure, including co‑location services near exchange data centers, specialized network hardware, and custom FPGA (field‑programmable gate array) accelerators. For example, an HFT strategy might exploit the price discrepancy between two commodity exchanges by instantly buying on the cheaper market and selling on the more expensive one, a practice known as statistical arbitrage. The technical challenge is maintaining sub‑millisecond latency while handling massive volumes of tick‑by‑tick data. Even small network delays can erode profit margins, making latency monitoring a critical operational function.
Application Programming Interface (API) is the set of protocols and tools that allow software components to communicate. In commodities trading, APIs enable the integration of market data feeds, order management systems, and risk engines. A typical workflow might involve a REST API call to retrieve the latest futures prices, processing the data through a pricing model, and then sending an order via a FIX (Financial Information eXchange) API to the broker’s execution platform. One practical issue is ensuring API version compatibility; when a data provider updates its schema, downstream systems must be adapted quickly to avoid data gaps.
FIX protocol is the industry‑standard messaging format for electronic trading. It defines a series of tags that convey order details, trade confirmations, and market data. For instance, tag 55 represents the instrument symbol (e.G., “CL” for crude oil), while tag 44 conveys the price. FIX messages are lightweight and designed for low‑latency transmission, making them ideal for both HFT and larger batch orders. Challenges include handling message sequencing errors and ensuring compliance with exchange‑specific extensions, which may require custom parsing logic.
Order Management System (OMS) is the software hub that tracks the life cycle of every order from creation through execution, allocation, and settlement. An OMS typically provides functionalities such as order routing, compliance checks, and post‑trade reporting. For example, a commodities trader may use the OMS to split a large block trade into smaller child orders that are sent to multiple venues to minimize market impact. The key technical difficulty lies in maintaining real‑time synchronization between the OMS and external execution venues, especially when dealing with high‑volume, high‑speed environments.
Execution Management System (EMS) works closely with the OMS but focuses specifically on the execution layer. It offers advanced features such as algorithm selection, real‑time market depth visualization, and performance analytics. An EMS might provide a suite of pre‑built algorithms, including VWAP (Volume‑Weighted Average Price) and TWAP (Time‑Weighted Average Price), allowing traders to select the most appropriate execution style for a given market condition. Integration challenges often revolve around latency, data consistency, and ensuring that the EMS can handle bursts of order traffic without dropping messages.
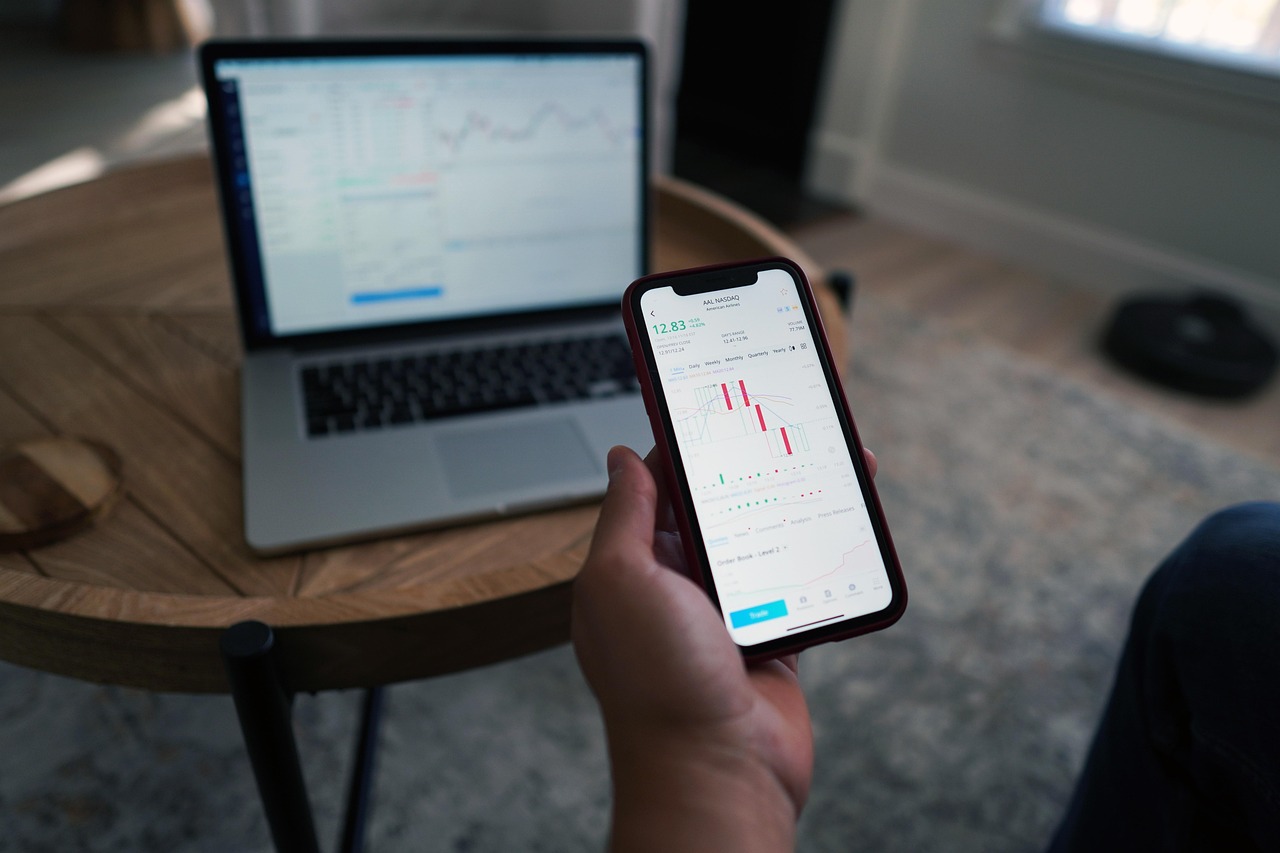
Market data feed is the continuous stream of price, volume, and order book information supplied by exchanges or third‑party providers. Feeds can be delivered via multicast, TCP, or WebSocket connections, each with its own latency and reliability characteristics. For example, a trader may subscribe to a Level 2 feed that includes the full depth of the order book for natural gas futures, enabling the construction of a detailed order book model. Common challenges include handling data spikes during market‑open periods, ensuring data integrity (e.G., Detecting and correcting out‑of‑sequence messages), and managing the storage of high‑frequency tick data for later analysis.
Data lake is a centralized repository that stores raw, unstructured, and semi‑structured data in its native format. In the commodities context, a data lake might ingest market tick data, weather satellite imagery, shipping manifests, and news articles. Storing data in a lake allows analysts to apply a variety of processing techniques without needing to conform to a rigid schema upfront. However, the lack of structure can lead to governance issues; without proper metadata tagging and data cataloging, finding relevant data becomes time‑consuming. Implementing a data lake thus requires a strong data governance framework that includes data lineage, ownership, and quality controls.
Data warehouse is a structured repository optimized for query performance and reporting. Unlike a data lake, a warehouse enforces a schema-on-write approach, where data is transformed and cleaned before loading. A typical commodity trading data warehouse might contain tables for historical price series, trade blotters, risk metrics, and regulatory filings. The warehouse enables rapid generation of management reports, such as daily P&L statements or compliance dashboards. Challenges include the need for frequent ETL (Extract, Transform, Load) processes to keep the warehouse up to date, and balancing the cost of storage with the performance demands of complex analytical queries.
ETL process (Extract, Transform, Load) is the workflow that moves data from source systems into a target repository, such as a data warehouse. Extraction pulls raw data from market feeds, ERP systems, and external data providers. Transformation cleanses the data—handling missing values, normalizing units (e.G., Converting barrels to cubic meters), and applying business rules. Loading writes the processed data into the target schema. A practical example is extracting daily settlement prices for copper futures, converting the prices to a common currency, and loading the result into a price history table. Common pain points include handling data format changes, ensuring data quality, and minimizing the latency of the ETL pipeline to keep the warehouse near‑real‑time.
Big data technologies such as Hadoop, Spark, and Kafka enable the processing of massive, high‑velocity datasets typical in commodities markets. Hadoop provides a distributed file system (HDFS) for storing petabytes of historical tick data, while Spark offers in‑memory computation for fast analytics, such as calculating rolling volatility across thousands of contracts simultaneously. Kafka serves as a high‑throughput message broker that can ingest real‑time market data and distribute it to downstream analytics engines. Implementing these technologies requires expertise in cluster management, resource allocation, and fault tolerance. Moreover, the cost of maintaining a big‑data infrastructure can be substantial, prompting many firms to consider cloud‑based alternatives.
Cloud computing offers on‑demand scalability and elasticity, allowing trading firms to spin up compute resources only when needed. For example, a firm might deploy a Spark cluster in the cloud to run a one‑off backtesting job that simulates a new strategy across ten years of minute‑level data. After the job completes, the cluster can be terminated, saving on infrastructure costs. Cloud providers also offer managed services for data lakes (e.G., Amazon S3), message queues (e.G., Azure Event Hubs), and serverless compute (e.G., Google Cloud Functions). Security and compliance remain critical concerns; firms must ensure data encryption at rest and in transit, manage identity and access controls, and adhere to regulatory data residency requirements.
Machine learning (ML) encompasses algorithms that learn patterns from data without explicit programming. In commodities trading, ML is applied to price forecasting, demand prediction, and risk classification. A typical use case is training a gradient‑boosted tree model on historical price, volume, and macro‑economic indicators to predict next‑day price movements for wheat futures. The model can then generate a signal that is fed into an execution algorithm. Challenges include data snooping bias, where the model inadvertently learns from future information, and the need for interpretability—regulators and risk managers often require an explanation of why a model made a particular prediction.
Artificial intelligence (AI) extends machine learning with capabilities such as natural language processing (NLP) and reinforcement learning. NLP can be used to parse news articles, analyst reports, and social media posts to extract sentiment about a commodity. For example, an AI system might scan weather reports and assign a “drought risk” score for corn, which then influences the pricing model. Reinforcement learning can be employed to develop adaptive trading agents that learn optimal actions through interaction with a simulated market environment. Implementing AI solutions demands robust data pipelines, substantial compute resources (often GPU‑accelerated), and careful validation to avoid unintended trading behavior.
Predictive analytics focuses on using statistical and ML techniques to forecast future outcomes. In the commodities space, predictive analytics may estimate future supply‑demand balances, price volatility, or the likelihood of a price spike due to geopolitical events. A practical application is a regression model that incorporates forward curve data, inventory levels, and macro‑economic indicators to forecast the price of natural gas for the next quarter. The output can be used to inform hedging decisions, such as locking in forward contracts to mitigate price risk. A key difficulty is the non‑stationary nature of commodity markets; relationships that held historically may break down when market regimes shift, requiring models to be regularly retrained.
Real‑time analytics processes data as it arrives, enabling immediate insight and action. Streaming platforms like Apache Flink or Spark Structured Streaming can calculate rolling statistics—such as a 5‑minute moving average of oil futures prices—directly on incoming tick data. These metrics can trigger alerts when thresholds are breached, for instance, when the price deviates more than two standard deviations from its recent average. The advantage is rapid response, but the challenge lies in maintaining stateful computations at scale while ensuring fault tolerance. Any interruption in the data stream could lead to missed signals or inaccurate metrics.
Latency is the time delay between the generation of a market event and its processing by a trading system. In HFT, latency is measured in microseconds, and even nanosecond improvements can translate into competitive advantage. Latency sources include network propagation delay, processing time in the operating system, and application‑level logic. Reducing latency often involves hardware optimizations (e.G., Using kernel bypass techniques), software tuning (e.G., Minimizing garbage collection pauses), and strategic placement of servers (co‑location). However, ultra‑low latency architectures can be costly and may increase operational complexity, requiring specialized expertise to maintain.
Data governance encompasses the policies, processes, and standards that ensure data is managed responsibly. In commodities trading, governance addresses data quality, security, privacy, and compliance. A data governance framework typically defines data owners, stewards, and custodians, each responsible for maintaining the integrity of specific data domains (e.G., Market prices, trade logs, client information). Governance tools may include data catalogs that document metadata, lineage diagrams that trace data transformations, and validation rules that enforce consistency (e.G., Ensuring all price data is timestamped in UTC). Without robust governance, firms risk regulatory penalties, operational errors, and loss of stakeholder confidence.
Data quality refers to the accuracy, completeness, consistency, and timeliness of data. Poor data quality can lead to erroneous pricing, mis‑aligned risk calculations, and faulty compliance reports. Common data quality issues include missing timestamps, duplicate trade records, and mismatched units (e.G., Barrels versus metric tons). Quality checks often involve profiling (e.G., Measuring the distribution of price values), validation (e.G., Ensuring price changes are within expected bounds), and remediation (e.G., Correcting or flagging anomalies). Implementing automated data quality pipelines helps catch problems early, but requires continuous monitoring and governance oversight.
Metadata is the data that describes other data, such as source, format, owner, and refresh schedule. In a commodity data lake, metadata might indicate that a particular dataset contains daily settlement prices for crude oil, sourced from the CME, updated at 16:00 UTC each day. Rich metadata enables efficient data discovery, lineage tracking, and impact analysis when changes occur. Tools like Apache Atlas or commercial data catalog solutions can automatically harvest metadata from ingestion pipelines, but they must be integrated with the overall data governance framework to be effective.
Data visualization transforms complex data sets into graphical representations that are easier to interpret. Commodity traders often use dashboards that display price heatmaps, volatility surfaces, and risk exposure charts. For example, a heatmap might show the correlation between different commodity pairs, highlighting which contracts move together. Interactive visualizations allow users to drill down from aggregate views to individual trades, facilitating rapid investigation of anomalies. The main challenge is ensuring that visualizations are both accurate and intuitive; poor design can mislead decision‑makers, while overly complex charts may obscure critical insights.
Dashboard is a real‑time interface that aggregates key performance indicators (KPIs) and alerts in a single view. A typical commodities dashboard includes metrics such as daily P&L, open positions, margin utilization, and VaR (Value‑at‑Risk). Alerts might be triggered when exposure to a single commodity exceeds a predefined limit or when market volatility surpasses a threshold. Building effective dashboards requires careful selection of data sources, efficient query design, and user‑friendly layout. Performance can become a bottleneck if the underlying queries are not optimized, especially when the dashboard refreshes every few seconds.
Key performance indicator (KPI) is a quantifiable measure used to evaluate the success of an organization or a specific activity. In commodities trading, KPIs may include trade execution speed, fill rate, slippage, and risk‑adjusted return (e.G., Sharpe ratio). Monitoring KPIs helps traders and managers assess whether strategies are meeting objectives and where operational improvements are needed. Defining appropriate KPIs requires alignment with business goals; for instance, a firm focused on risk mitigation may prioritize VaR and stress‑test outcomes over pure profitability metrics.
Risk metrics are quantitative measures that assess the exposure of a trading portfolio to various sources of uncertainty. Common metrics include VaR, Expected Shortfall (ES), and stress‑test results. VaR estimates the maximum loss over a specified horizon at a given confidence level (e.G., 99%). Expected Shortfall provides the average loss beyond the VaR threshold, offering a more comprehensive view of tail risk. Stress testing involves applying extreme but plausible scenarios—such as a sudden supply shock in natural gas—to the portfolio to see how losses would evolve. Calculating these metrics requires robust data on positions, market prices, and volatilities, and the models must be validated regularly to meet regulatory standards.
Value‑at‑Risk (VaR) is a statistical technique that quantifies the potential loss in a portfolio over a defined time horizon at a certain confidence level. A VaR of $10 million at 99% confidence over one day means that there is a 1% chance the portfolio will lose more than $10 million in a single day. VaR can be computed using historical simulation, variance‑covariance, or Monte‑Carlo methods. While VaR is widely used, it has limitations: It assumes normal market conditions and may underestimate extreme events. Therefore, many firms complement VaR with stress testing and Expected Shortfall to capture tail risk more accurately.
Stress testing evaluates how a portfolio would perform under severe but plausible market conditions. In commodities, stress scenarios might include a sudden embargo on oil exports, a catastrophic weather event affecting agricultural yields, or a rapid shift in currency exchange rates. The process involves revaluing all positions using altered market inputs (e.G., A 30% drop in crude oil price) and measuring the resulting P&L impact. Stress testing helps identify hidden concentrations of risk and informs contingency planning. A practical challenge is the selection of realistic scenarios; overly extreme assumptions can lead to unnecessary capital buffers, while insufficiently severe scenarios may miss critical vulnerabilities.
Scenario analysis is a broader form of stress testing that examines the impact of multiple, often interrelated, market events. For example, a scenario may combine a sharp increase in natural gas demand due to a cold winter with a simultaneous reduction in supply caused by pipeline disruptions. Scenario analysis requires a flexible modeling environment that can adjust multiple variables simultaneously and propagate their effects through valuation models. The output is typically a range of potential outcomes that can be used for capital planning and strategic decision‑making. Maintaining an up‑to‑date library of scenarios demands collaboration between traders, risk analysts, and macro‑economists.
Data lineage tracks the flow of data from its source through each transformation step to its final destination. Understanding lineage is essential for auditability and impact analysis: If a source feed changes its format, the lineage diagram shows which downstream models and reports will be affected. Automated lineage capture tools can record metadata as data moves through ETL pipelines, providing a visual map that links raw market data to derived risk metrics. The main difficulty is ensuring that lineage information remains accurate as pipelines evolve; manual updates are error‑prone, so organizations often rely on integrated data catalog solutions.
Data security encompasses measures to protect data from unauthorized access, alteration, or loss. In the commodities domain, security concerns include safeguarding proprietary pricing models, client transaction data, and sensitive market intelligence. Common controls are encryption (both at rest and in transit), strong authentication (e.G., Multi‑factor), role‑based access control, and network segmentation. A practical security architecture might place the OMS in a private subnet, enforce TLS for all API communications, and use hardware security modules (HSMs) to protect encryption keys. Balancing security with performance is a recurring challenge; overly aggressive encryption can increase latency, which is critical for high‑frequency strategies.
Compliance reporting is the process of generating and submitting required information to regulatory bodies. For commodities traders, this may involve reporting trade details to the Commodity Futures Trading Commission (CFTC), European Securities and Markets Authority (ESMA), or local exchange regulators. Reports typically include transaction timestamps, counterparties, instrument identifiers, and execution venues. Automated compliance engines ingest trade blotters, enrich the data with required fields (e.G., LEI—Legal Entity Identifier), and produce standardized reports in formats such as XML or JSON. Failure to submit accurate reports on time can result in fines and reputational damage, making robust compliance automation essential.
Trade surveillance monitors trading activity to detect market abuse, insider trading, or manipulation. Surveillance systems analyze patterns such as repeated large orders placed just before price moves, or coordinated activity across multiple accounts. Machine‑learning classifiers can flag suspicious behavior based on historical abuse cases. Once a potential violation is identified, compliance teams investigate and, if necessary, report to regulators. The key operational difficulty is balancing false‑positive rates; overly sensitive systems generate excessive alerts, overwhelming investigators, while lax settings may miss genuine misconduct.
Market microstructure studies the mechanisms through which prices are formed, including order flow, liquidity provision, and information dissemination. Understanding microstructure is vital for designing execution algorithms that minimize market impact. For instance, a trader may analyze the depth of the order book (Level 2 data) to gauge the resilience of liquidity for a particular commodity future. Microstructure analysis can reveal hidden costs such as the bid‑ask spread, price impact, and adverse selection. Implementing microstructure‑aware strategies requires high‑frequency data, sophisticated statistical models, and continuous monitoring of market conditions.
Order book displays the list of buy and sell orders at various price levels for a given instrument. The top of the book (best bid and best ask) reflects the immediate market price, while deeper levels show the available liquidity. Traders use order‑book data to assess market depth, identify support and resistance zones, and gauge the potential impact of large orders. A common metric derived from the order book is the order‑book imbalance, calculated as (Bid Volume – Ask Volume) / (Bid Volume + Ask Volume). A high imbalance may indicate directional pressure, influencing execution decisions. Maintaining a high‑quality order‑book feed involves handling high‑frequency updates and ensuring low latency.
Depth of market (DOM) is another term for the order book, emphasizing the quantity of orders available at each price level. DOM visualizations often present the cumulative volume on the bid and ask sides, enabling traders to see how much liquidity is present before a price moves a certain number of ticks. For example, a trader might observe that there is only a small amount of sell orders at the current price, suggesting that a modest buy order could push the price upward. The challenge lies in processing the rapid updates to the DOM without introducing latency that would render the information stale.
Limit order is an instruction to buy or sell a commodity at a specified price or better. If the market does not reach the limit price, the order remains open (or is canceled, depending on the time‑in‑force setting). Limit orders provide price certainty but no guarantee of execution. Traders often use limit orders to control slippage, especially in less liquid markets where market orders could move the price unfavorably. Managing a portfolio of limit orders requires careful monitoring of market conditions to adjust or cancel orders before they become stale.
Market order instructs the broker to execute the trade immediately at the best available price. Market orders guarantee execution but expose the trader to price uncertainty, especially in volatile or thinly‑traded commodity markets. A typical use case for market orders is when a trader needs to exit a position quickly to limit losses. The primary risk is slippage, where the final execution price deviates significantly from the price observed at order entry. Monitoring real‑time market depth and setting appropriate thresholds can help mitigate excessive slippage.
Stop order becomes a market order once a predefined price level is reached. In commodities trading, a stop‑loss order might be placed 5% below the entry price to automatically exit a position if the market moves against the trader. Stop orders help enforce risk limits without requiring active monitoring. However, in fast‑moving markets, the stop price can be triggered, and the subsequent market order may execute at a much worse price due to gaps or low liquidity—a phenomenon known as “stop‑run”. Proper placement and sizing of stop orders, possibly combined with protective limit orders, can reduce this risk.
Statistical arbitrage exploits pricing inefficiencies identified through statistical models. In commodities, a statistical arbitrage strategy might involve pairs trading: Simultaneously buying a commodity that is undervalued relative to a related instrument and selling the overvalued counterpart. The relationship is quantified using historical correlation and cointegration analysis. When the spread between the two contracts narrows, the trade is unwound for a profit. Successful statistical arbitrage depends on low transaction costs, reliable data, and robust risk controls because the expected profit per trade is often small.
Pairs trading is a specific form of statistical arbitrage that focuses on two correlated commodities, such as Brent crude oil and West Texas Intermediate (WTI) crude. The trader monitors the spread between the two prices; when the spread widens beyond a statistical threshold, the trader goes long on the cheaper contract and short on the more expensive one, betting that the spread will revert. Execution must be fast to capture the mean‑reversion before the spread normalizes. Challenges include ensuring that the correlation remains stable over time and accounting for differing contract specifications (e.G., Delivery locations, grades).
Commodity futures are standardized contracts obligating the holder to buy or sell a specific quantity of a commodity at a predetermined price on a future date. Futures are the cornerstone of most commodity trading strategies, providing liquidity, price discovery, and the ability to hedge physical exposure. For example, a wheat producer may sell wheat futures to lock in a price for the upcoming harvest, mitigating the risk of price declines. Futures pricing incorporates the cost‑of‑carry model, reflecting storage costs, interest rates, and convenience yields. Understanding these dynamics is essential for accurate valuation and risk management.
Options on commodities grant the holder the right, but not the obligation, to buy (call) or sell (put) a commodity at a specified strike price before expiration. Options are used to hedge downside risk, generate income through premium collection, or implement complex payoff structures. For instance, a trader might buy a put option on crude oil to protect against a price decline while retaining upside potential. Option pricing models, such as Black‑Scholes or the more commodity‑specific Bachelier model, require inputs like volatility, time to expiry, and risk‑free rates. Managing option positions adds complexity due to the need for Greeks (Delta, Gamma, Theta, Vega) to monitor sensitivity.
Swaps are over‑the‑counter (OTC) agreements in which two parties exchange cash flows based on different underlying price indices. In commodities, a common swap is a fixed‑for‑floating price swap, where a producer receives a fixed price for a commodity while paying a floating market price, effectively locking in revenue. Swaps are useful for hedging long‑term exposure but introduce counterparty risk, as they are not centrally cleared. Therefore, robust credit risk assessment and collateral management are required. Documentation standards such as ISDA Master Agreements govern swap terms and provide legal certainty.
Physical settlement occurs when a futures contract is fulfilled by delivering the actual commodity, rather than settling in cash. Physical settlement is common in energy and agricultural markets, where contracts specify delivery points, quality grades, and timing. Traders must manage logistics, storage, and transportation to meet settlement obligations. Failure to deliver can result in penalties or forced liquidation at adverse prices. Consequently, many market participants prefer cash‑settled contracts or use physical settlement only when they have the infrastructure to handle the commodity.
Electronic trading platform provides a digital interface for market participants to view quotes, place orders, and manage positions. Platforms such as CME Globex, ICE Connect, and proprietary systems offer low‑latency access to multiple commodity exchanges. Features typically include real‑time market data, order entry screens, algorithm libraries, and risk controls. Integration with OMS/EMS, data warehouses, and compliance tools is essential for end‑to‑end workflow automation. Platform reliability, latency, and uptime are critical performance metrics; outages can disrupt trading and lead to missed opportunities.
Clearinghouse acts as the central counterparty for trades, guaranteeing performance and managing settlement risk. In commodity markets, clearinghouses such as CME Clearing or LCH.Clearnet collect initial margin, perform daily mark‑to‑market, and enforce margin calls. By novating trades, the clearinghouse reduces bilateral counterparty exposure, enhancing market stability. Participants must adhere to the clearinghouse’s risk rules, including position limits and collateral requirements. Operational challenges include timely margin calculations, accurate valuation of positions across multiple instruments, and managing collateral movements.
Margin is the collateral required to open and maintain a leveraged position. Initial margin is posted at trade inception, while variation margin is exchanged daily to reflect changes in market value. In commodities, margin requirements are often higher for volatile contracts such as natural gas or for illiquid contracts. Effective margin management involves optimizing collateral usage, monitoring margin calls, and ensuring sufficient liquidity to meet obligations. Inadequate margin can lead to forced liquidation, increasing market risk and potential losses.
Collateral includes cash, government securities, or other high‑quality assets pledged to secure margin obligations. Collateral management systems track eligibility, haircuts, and concentration limits. For example, a trader may pledge Treasury bonds as collateral for a futures position, applying a haircut of 2% to account for market risk. The system must ensure that collateral is re‑valuated regularly to reflect market price changes and that any shortfall triggers a margin call. Efficient collateral usage can improve capital efficiency, but it requires sophisticated analytics and robust governance.
Netting reduces the number of settlements by offsetting opposite positions between counterparties. For instance, if a firm holds both long and short positions in the same commodity with the same counterparty, the net exposure can be settled with a single payment rather than multiple gross payments. Netting lowers operational risk, reduces settlement costs, and improves liquidity management. Implementing netting requires accurate position aggregation, agreement on netting rules, and coordination with clearinghouses and custodians.
Position management tracks the aggregate exposure across all instruments, desks, and accounts. It provides a consolidated view of net long or short quantities, dollar exposure, and risk metrics. Position limits are set to prevent excessive concentration in a single commodity, geography, or counterparty. Real‑time position monitoring alerts risk managers when limits are approached or breached. Integration with OMS/EMS, risk engines, and reporting systems is essential to maintain a single source of truth.
P&L attribution breaks down profit and loss into its constituent drivers, such as price movement, carry, basis, and transaction costs. Attribution helps traders understand the sources of performance and identify areas for improvement. For example, a crude oil trader may discover that most of the P&L came from favorable roll yields, while transaction costs eroded a portion of the gains. Accurate attribution requires high‑frequency price data, precise position records, and consistent accounting rules. Discrepancies can arise from mismatched timestamps, rounding errors, or differing conventions for handling corporate actions.
Backtesting evaluates a trading strategy by applying it to historical data to assess performance. In commodities, backtesting may involve simulating trades on daily settlement prices, incorporating realistic transaction costs, slippage, and margin requirements. The process typically includes data preprocessing, signal generation, order execution modeling, and performance reporting (e.G., Sharpe ratio, maximum drawdown). A key challenge is survivorship bias, where the dataset excludes contracts that have expired or been delisted, leading to overly optimistic results. Robust backtesting frameworks incorporate rolling windows, out‑of‑sample validation, and sensitivity analysis.
Simulation extends backtesting by modeling market dynamics and order execution in a more realistic environment. Monte‑Carlo simulation can generate multiple price paths for a commodity based on stochastic processes (e.G., Geometric Brownian Motion) to assess the distribution of outcomes. Agent‑based simulation may model interactions between multiple market participants, capturing the impact of order flow and liquidity. Simulations are valuable for stress testing, capacity planning, and evaluating the robustness of execution algorithms under varying market conditions. However, they require accurate parameter calibration and can be computationally intensive.
Data mining involves extracting patterns and insights from large datasets. In commodities, data mining techniques such as clustering can group similar contracts based on volatility, liquidity, and price behavior. Association rule mining might reveal relationships between weather patterns and agricultural commodity prices. The insights derived can inform strategy development, risk segmentation, and portfolio construction. Effective data mining demands clean, well‑structured data, appropriate feature engineering, and domain expertise to interpret results correctly.
Regression analysis estimates the relationship between a dependent variable (e.G., Commodity price) and one or more independent variables (e.G., Inventory levels, macro‑economic indicators). Linear regression is often used for simple price‑forecasting models, while more advanced techniques like ridge regression or LASSO address multicollinearity and over‑fitting. For example, a regression model might predict natural gas prices based on temperature forecasts, storage data, and oil prices. Model validation, residual analysis, and out‑of‑sample testing are essential to ensure predictive reliability.
Classification assigns observations to predefined categories. In commodities, classification models can label market regimes (e.G., “Contango” vs “backwardation”) or identify high‑risk trades. Techniques such as logistic regression, decision trees, or support vector machines can be applied. A practical application is using a classifier to flag trades that exhibit unusual price‑volume relationships, prompting further review. Ensuring balanced training data and avoiding bias are critical to achieving accurate classification.
Natural language processing (NLP) enables machines to interpret and extract information from textual data. In commodities trading, NLP can process news articles, analyst reports, and social media to gauge sentiment about a particular commodity. For instance, an NLP pipeline might identify mentions of “crop failure” in South America and assign a negative sentiment score to soybean futures. Sentiment scores can be incorporated into pricing models or used to trigger alerts. The main challenges are handling domain‑specific terminology, multilingual sources, and ensuring that the extracted sentiment aligns with actual market impact.
Key takeaways
- A common challenge is model over‑fitting, where a strategy performs well on historical data but fails in live markets because it has captured noise rather than true market dynamics.
- For example, an HFT strategy might exploit the price discrepancy between two commodity exchanges by instantly buying on the cheaper market and selling on the more expensive one, a practice known as statistical arbitrage.
- One practical issue is ensuring API version compatibility; when a data provider updates its schema, downstream systems must be adapted quickly to avoid data gaps.
- Challenges include handling message sequencing errors and ensuring compliance with exchange‑specific extensions, which may require custom parsing logic.
- The key technical difficulty lies in maintaining real‑time synchronization between the OMS and external execution venues, especially when dealing with high‑volume, high‑speed environments.
- An EMS might provide a suite of pre‑built algorithms, including VWAP (Volume‑Weighted Average Price) and TWAP (Time‑Weighted Average Price), allowing traders to select the most appropriate execution style for a given market condition.
- For example, a trader may subscribe to a Level 2 feed that includes the full depth of the order book for natural gas futures, enabling the construction of a detailed order book model.